Keeping an eye on the iPlayer
Published February 15, 2011
When the iPlayer stats first started appearing, they were a one-page document with just a few bits and bobs to take note of. Now, it’s a 20-page pdf full of fascinating figures and statistics.
There were a few pages of January’s statistics that I found more interesting than others. Firstly, the average minutes consumed by users per week.
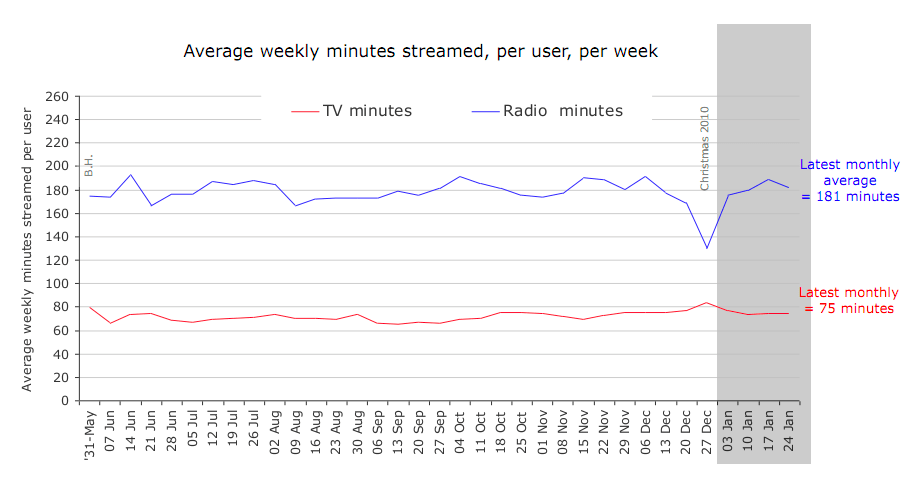
That’s just over six months of data and it doesn’t seem to be getting much higher or lower. These people are clearly not like me, who consumes pretty much all my TV via the iPlayer… and that amounts to more than 75 minutes!
I am quite astonished at the difference between radio and TV, but they are very different audiences. The only visible blip is for Christmas, where people watched more TV via iPlayer but listened to less radio.
The other interesting pages are about which episodes of various programmes were the most popular. When I saw that Come Fly With Me had been recommissioned for a second series, I had a bit of a rant at Mr C, which ultimately was: “How can they order a second series of this at the blink of an eye, whereas there had to be a campaign to get Not Going Out back again?”
This might be why:
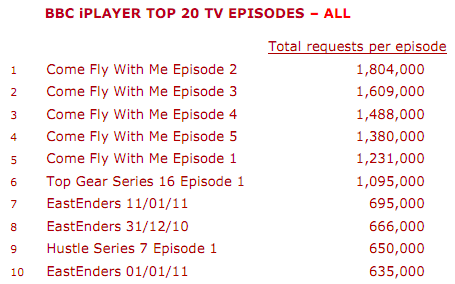
There is no Not Going Out in the entire top 20, nor for the top 20 of individual series (so that Come Fly With Me is only represented once). The radio one is interesting too:
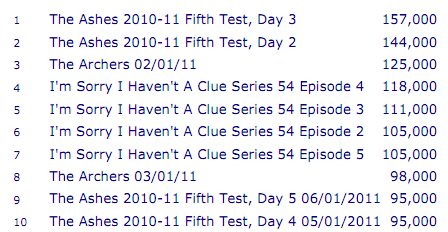
That first Archers episode is the double-length anniversary edition, and the second Archers episode is obviously the day after that - the aftermath. Aside from a few Archers episodes peppering the list, it is all cricket and comedy.
Finally, there are a couple of graphs which highlight the times of day when the iPlayer is used more, and for the TV side it peaks at about 10pm, whilst radio peaks in the morning at 8am.
I love this stuff, and now that the statistics are so much more useful, I’ll be keeping an eye on them as they are published.